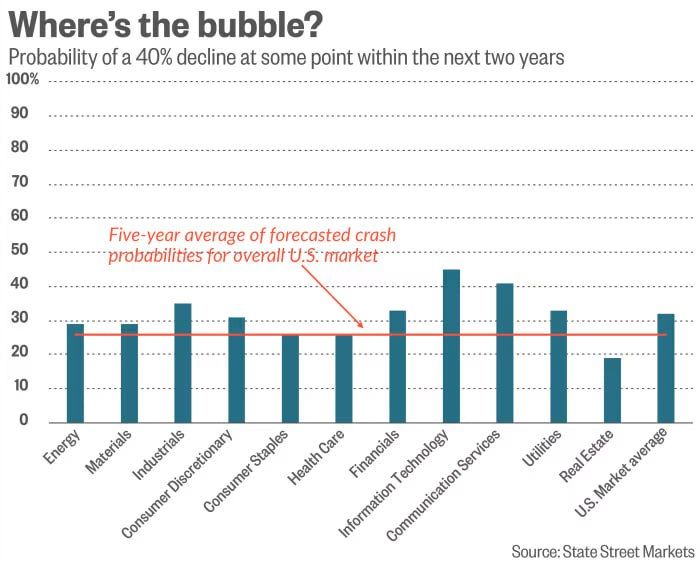
While the technology sector is currently flagged as the most overheated segment with a 45% crash probability, the data suggests the broader US market is not yet on the precipice of a systemic collapse.
Identifying an asset bubble in real-time has long been one of the holy grails of economic forecasting. While conventional market wisdom often relies on gut feeling or simple price-to-earnings ratios, a joint research initiative between State Street and a Harvard economist has introduced a highly systematized approach to decoding market crashes.
The researchers focused on a specific metric: the degree to which an individual sector outpaces the broader market index over a two-year window. Their findings suggest that the wider this performance gap grows, the more certainty there is of an impending correction.
According to the historical data driving the model, a sector that noticeably outruns the market faces a baseline 53% chance of experiencing a subsequent crash of at least 40% within the following two years. However, as the outperformance accelerates, the mathematical probability of a collapse surges dramatically:
- A 125 percentage point gap yields a 76% probability of a crash.
- A 150 percentage point gap drives the likelihood up to 80%.
Where the Market Stands Today
Despite widespread anxiety regarding current valuations, the model suggests that the broader US equity market is not on the precipice of a systemic collapse.
Unsurprisingly, the technology sector is currently flagged as the most overheated segment of the market. The model places the current probability of a major tech sector crash at 45%. While this represents an elevated risk profile, it is only a modest increase over the sector's five-year average baseline of roughly 35%.
To put the current tech landscape into historical perspective, the model indicated a near-100% probability of a crash at the absolute peak of the dot-com bubble in 2000. For now, the data indicates that while the tech sector is running hot, it has not yet reached the terminal velocity associated with past catastrophic market corrections.